Correlation Coefficient Calculator
Correlation Coefficient (ρ) - work with steps
Input Data :
Data set x = 1, 2, 4, 5, 8
Data set y = 5, 20, 40, 80, 100
Total number of elements = 5
Objective :
Find what is correlation coefficient for given input data?
Solution :
`x_i = `1, 2, 4, 5, 8 Mean `\mu_X = 20/5 = 4`
`y_i = `5, 20, 40, 80, 100 Mean `\mu_Y = 245/5 = 49`
| `(x_i - \mu_X)` | `(x_i - \mu_X)^2` | `(y_i - \mu_Y)` | `(y_i - \mu_Y)^2` | `(x_i - \mu_X)(y_i - \mu_Y)` |
|---|---|---|---|---|
| -3 | 9 | -44 | 1936 | 132 |
| -2 | 4 | -29 | 841 | 58 |
| 0 | 0 | -9 | 81 | -0 |
| 1 | 1 | 31 | 961 | 31 |
| 4 | 16 | 51 | 2601 | 204 |
| `\sum(x_i - \mu_X)^2``=30` | `\sum(y_i - \mu_Y)^2``=6420` | `\sum(x_i - \mu_X)(y_i - \mu_Y)``=425` |
`=\sqrt{6}`
`σ_X=2.4495`
`σ_Y=\sqrt{\frac{6420}{5}`
`=\sqrt{1284}`
`σ_Y=35.8329`
`ρ_(XY)=\frac{1}{5}\times frac{425}{2.4495\times35.8329}`
`=\frac{1}{5}\times frac{425}{87.7724}`
`=\frac{425}{438.8622}`
`ρ_(XY)=0.9684`
Correlation Coefficient calculator measures the degree of dependence or linear correlation between two random samples $X$ and $Y$ or two sets of population data. It's an online statistics and probability tool requires two random samples $X$ and $Y$ or two sets of population data. In other words, it measures how strongly and in which direction the linear relationship between the the two data sets.
It is necessary to follow the next steps:
- Enter two samples $X$ and $Y$ (observed values) in the box. These values must be real numbers or variables and may be separated by commas. The values can be copied from a text document or a spreadsheet.
- Press the "GENERATE WORK" button to make the computation.
- Correlation coefficient calculator will give the linear correlation between the data sets.
Output : A real number
Correlation coefficient calculator gives us the stepwise procedure and insight into every step of calculation. Before the final result of correlation coefficient is derived, it calculates the sample mean and standard deviations of two sets of data. These values of the sample mean and the standard deviations can be of benefit for further solving of problems and applications.
Correlation Coefficient Formula :
Sample correlation coefficient of $X$ and $Y$ is determined by the formula
Population Correlation Coefficient Formula:
Population correlation coefficient of $X$ and $Y$ is determined by the formula
What is Correlation Coefficient?
Let us consider two variables,
A correlation coefficient, usually denoted by $r_{XY}$, measures how close a set of data points is to being linear. In other words, it measures the degree of dependence or linear correlation (statistical relationship) between two random samples or two sets of population data. The correlation coefficient uses values between $-1$ and $1$.
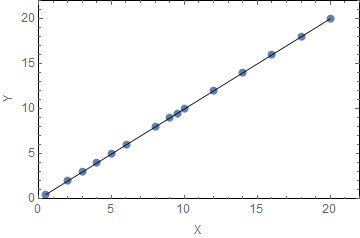
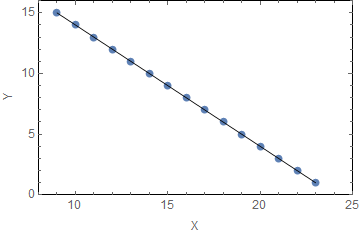
For example, in the first picture, $r_{XY}=1$, and the data points are on a the line with positive slope. In the second picture, $r_{XY}=-1,$ and the data points are on the line with negative slope.


- If $|r_{XY}|=1$, there is perfect correlation between $X$ and $Y$;
- If $r_{XY}=0$, there is no correlation between $X$ and $Y$.
How to Calculate Correlation Coefficient?
Let $X=(x_1,\ldots,x_n)$ and $Y=(y_1,\ldots, y_n)$ be samples of $n$ outcomes. The means of these samples are
To find the sample correlation coefficient, we need to follow the next steps:
- Find the sample mean $\bar{X}$ for data set $X$;
- Find the sample mean $\bar{Y}$ for data set $Y$;
- Find the sample standard deviation $s_X$ for sample data set $X$;
- Find the sample standard deviation $s_Y$ for data set $Y$;
- Substitute values in the formula for correlation coefficient to get the result.
The work with steps shows the complete step-by-step calculation for how to find the correlation coefficient of the two samples $X: 1,2,4,5,8$ and $Y: 5,20,40,80,100$ by using tabular method. For any other samples, just supply two lists of numbers and click on the "GENERATE WORK" button. The grade school students may use this calculator to generate the work, verify the results derived by hand or do their homework problems efficiently.
Practice Problems for Correlation Coefficient
The correlation coefficient is useful in finance. For example, in determining how well a mutual fund performs relative to its benchmark index, or another fund.
Practice problems of the correlation coefficient are provided using data from statistical simulations as well as real data.
Practice Problem 1: Find the correlation coefficient of the data in the table which shows the relationship between temperature and the weakness felt in various extremities.
| body temperature | Number of extremities |
|---|---|
| $38.2^o$ | $4$ |
| $37.5^o$ | $7$ |
| $37.9^o$ | $6$ |
| $39.2^o$ | $10$ |
| $40^o$ | $12$ |
| $36.9^o$ | $2$ |
| $39.1^o$ | $5$ |
| Number of extremities | Statistics | |
| Monday | 134 | 231 |
| Tuesday | 156 | 127 |
| Wednesday | 234 | 276 |
| Thursday | 214 | 265 |
| Friday | 301 | 124 |
The correlation coefficient calculator, formula, work with steps (tabular method) and practice problems would be very useful for grade school students of K-12 education to learn what is correlation coefficient of a data set in statistics and probability, how to find it. It's applications in real life is of great significance.
