Standard Error (SE) of Mean Calculator
Standard Error (SE) of Mean - work with steps
Input Data :
Input = 10, 20, 30, 40
Objective :
Find what standard error for given input data?
Formula :

Solution :
Mean = (10 + 20 + 30 + 40)/4
= 100/4
Mean = 25
Standard Deviation σ = √(1/4 - 1) x ((10 - 25)2 + ( 20 - 25)2 + ( 30 - 25)2 + ( 40 - 25)2)
= √(1/3) x ((-15)2 + (-5)2 + (5)2 + (15)2)
= √(0.3333) x ((225) + (25) + (25) + (225))
= √(0.3333) x 500
= √166.6667
Standard Deviation σ = 12.9099
Standard Error = σ√n
= 12.9099√4
= 12.90992
Standard Error = 6.455
standard error (SE) calculator - to estimate the sample mean dispersion from the population mean for statistical data analysis. In the context of statistical data analysis, the mean & standard deviation of sample population data is used to estimate the degree of dispersion of the individual data within the sample but the standard error of mean (SEM) is used to estimate the sample mean (instead of individual data) dispersion from the population mean. In more general, the standard error (SE) along with sample mean is used to estimate the approximate confidence intervals for the mean. It is also known as standard error of mean or measurement often denoted by SE, SEM or SE. The estimation with lower SE indicates that it has more precise measurement. And the standard score of individual sample of the population data can be measured by using the z score calculator
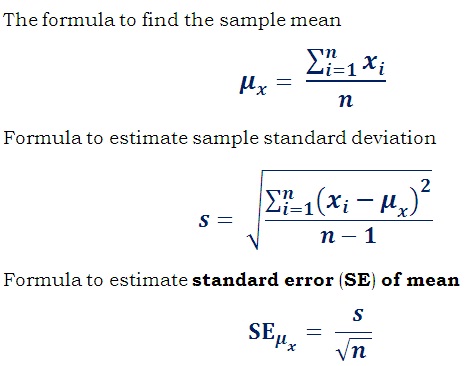
Formulas - standard error (SE)
The below formulas are used to estimate the standard error (SE) of the mean and the example problem illustrates how the sample population data values are being used in the mathematical formula to find approximate confidence intervals for the mean.

How to calculate Standard Error?
The below step by step procedures help users to understand how to calculate standard error using above formulas.
1. Estimate the sample mean for the given sample of the population data.
2. Estimate the sample standard deviation for the given data.
3. Dividing the sample standard deviation by the square root of sample mean provides the standard error of the mean (SEM).
Solved Example
The below solved example for to estimate the sample mean dispersion from the population mean using the above formulas provides the complete step by step calculation. This standard error calculator alongside provides the complete step by step calculation for the given inputs.
Example Problem:
Estimate the standard error for the sample data 78.53, 79.62, 80.25, 81.05, 83.21, and 83.46?
Solution:
Step 1: find the sample mean
Inputs (n) = (78.53, 79.62, 80.25, 81.05, 83.21, 83.46)
Total Inputs (n) = 6
Mean (μx) = (x1)+ x2) + x3) + ... + xn) / n
= 486.119 / 6
= 81.02
Step 2: find the sample standard deviation
SD = √(1/(n - 1)*((x1 - μx)2 + (x2 - μx)2 + ... +(xn - μx)2))
= √(1/(6 - 1)((78.53 - 81.02)2 + (79.62 - 81.02)2 + (80.25 - 81.02)2 + (81.05 - 81.02)2 + (83.21 - 81.02)2 + (83.46 - 81.02)2))
= √(1/5((-2.4899)2 + (-1.3999)2 + (-0.7699)2 + (0.0300)2 + (2.1899)2 + (2.4399)2))
= √(1/5((6.2000) + (1.9599) + (0.5928) + (0.0009) + (4.7960) + (5.9535)))
= √(3.9007)
σx= 1.975
Step 3: find the standard error (SE) of mean
Standard Error (SEμx) = SD / √(n)
= 1.975/√(6)
= 1.975/2.449
SEμx = 0.8063
In the context probability & statistics for data analysis, the estimation of standard error (SE) of mean is used in various fields including finance, tele-communication, digital & analog signal processing, polling etc. The manual calculation can be done by using above formulas. When it comes to verify the results or perform such calculations, this standard error calculator makes your calculation as simple as possible.
