Grouped Data Standard Deviation Calculator
Grouped data standard deviation calculator - step by step calculation to measure the dispersion for the frequency distribution from the expected value or mean based on the group or range & frequency of data, provided with formula & solved example problems. By using this calculator, user can get complete step by step calculation for the data being used. The frequency distribution standard deviation formula along with the solved example let the users to understand how the values are being used in this calculation. It's one of a probability & statistics tools using the mid-point method to find the deviation of the grouped data.
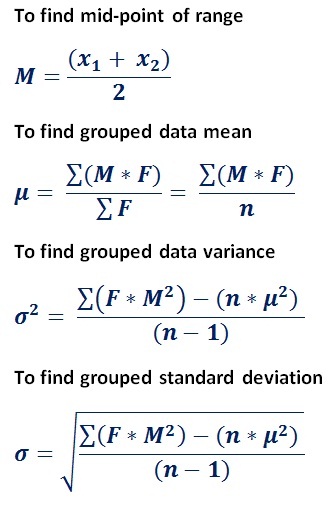
Formula
The below statistical formulas are employed to find the standard deviation for the frequency distribution table data set

How to calculate grouped data standard deviation?
Step by step calculation:
Follow these below steps using the above formulas to understand how to calculate standard deviation for the frequency table data set
step 1: find the mid-point for each group or range of the frequency table.
step 2: calculate the number of samples of a data set by summing up the frequencies.
step 3: find the mean for the grouped data by dividing the addition of multiplication of each group mid-point and frequency of the data set by the number of samples.
step 4: calculate the variance for the frequency table data by using the above formula.
step 5:estimate standard deviation for the frequency table by taking square root of the variance.
Solved Example Problem
This below solved example problem for frequency distribution standard deviation may help the users to understand how the values are being used to workout such calculation based on the above mathematical formulas.
Example Problem:
In a class of students, 9 students scored 50 to 60, 7 students scored 61 to 70, 9 students scored 71 to 85, 12 students scored 86 to 95 and 8 students scored 96 to 100 in the subject of mathematics. Estimate the standard deviation?
Solution:
Input:
| Range | Frequency |
| 50-60 | 9 |
| 61-70 | 7 |
| 71-85 | 9 |
| 86-95 | 12 |
| 96-100 | 8 |
step 1: find the mid-point M for each group
(50 + 60)/2 = 55
(61 + 70)/2 = 65.5
(71 + 85)/2 = 78
(86 + 95)/2 = 90.5
(96 + 100)/2 = 98
The mid points are 55, 65.5, 78, 90.5 & 98 for the group of students 50 to 60, 61 to 70, 71 to 85, 86 to 95 & 96 to 100 repectively.
step 2: calculate the number of samples n
n = 9 + 7 + 9 + 12 + 8
n = 45
step 3: find the grouped data mean μ
μ = (55 x 9 + 65.5 x 7 + 78 x 9 + 90.5 x 12 + 98 x 8 )/n
= 3525.5/45
μ = 78.3444
step 4: find the variance σ2
= (((9 x 552) + (7 x 65.52) + (9 x 782) + (12 x 90.52) + (8 x 982)) - (45 x 78.34442))/(45 - 1)
= (287127.75 - 276203.025)/ 44
σ2 = 248.2820
step 5: find standard deviation for the grouped data
Take square root of variance
σ = 15.7569
The statistics function grouped standard deviation is used in various applications for statistical data analysis. When it comes to online, this grouped standard deviation calculator along with formula, step by step calculation & solved example problem let the users to understand, workout, perform & verify such calculations.
