Normal Distribution Calculator
Normal Distribution calculator calculates the area under a bell curve and gives the probability which is higher or lower than any arbitrary $X$. It's an online statistics and probability tool requires range of variable, $X_1$ to $X_2$, mean of normal distribution and standard deviation to find the corresponding probabilities. More precisely, this Guassian distribution calculator help us to find: probability less than a $X_1$, probability greater than a $X_1$, probability less than a $X_2$, probability greater than a $X_2$ and probability between $X_1$ and $X_2$.
It is necessary to follow the next steps:
- Enter the population mean, the standard deviation of the population and two value $X_1$ and $X_2$ in the box. These values must be real numbers.
- Press the "CALCULATE" button to make the computation.
- Normal distribution calculator will give the probabilities of a values which are higher or lower than $X_1$ and $X_2$. It also calculates the probability between $X_1$ and $X_2$ for a given mean and standard deviation.
Output: Four numbers in range $[0,1]$ since the probability must be a real number between 0 and 1.
Normal Distribution Formula:
What is Normal Distribution?
The normal distribution plays an important role in probability theory. In 1809, C.F. Gauss gave the first application of the normal distribution. He modeled observational errors in astronomy.
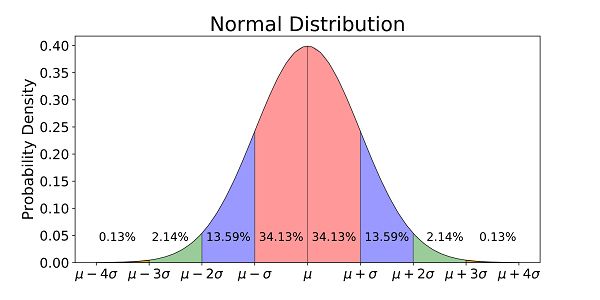
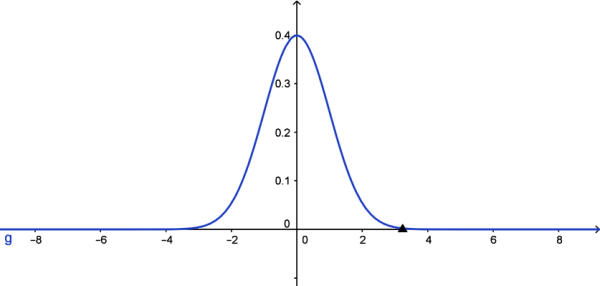
Normal (Gaussian) distribution is a continuous probability distribution. The normal distribution is connected with many natural phenomena so it can be used for many probability problems. The normal distribution is defined with the probability density function
$$f(x)=\frac1{\sqrt{2\pi \sigma^2}} e^{-\frac{(x-\mu)^2}{2\sigma^2 }}$$
where $\mu$ is the population mean and $\sigma^2$ is the population variance. Mathematical constants $e$ and $\pi$ are approximately equal $2.7183$
and $3.1416$, respectively.
If a random variable $X$ has the normal distribution, then it is denoted by $X\sim N(\mu, \sigma^2)$.


How to Calculate Normal Distribution?
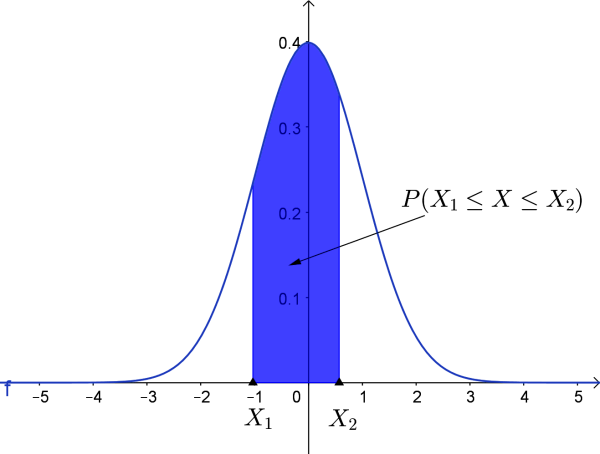
To find the probability $P(X_1 < X < X_2)$, we need to find the area under the normal curve between the points $X_1$ and $X_2.$
$z$-scores can be used to calculate probability by comparing the location of the $z$-score to the area under a normal curve either to the left or right. $z$-score is determined by the formula
$$z=\frac{x-\mu}{\sigma}$$
where $x$ is a random member, $\mu$ is an expected mean of population and
$\sigma$ is the standard deviation of an entire population. Clearly, if $x<\mu$, the value of $z$ is negative, if $x>\mu$, the value of $z$ is positive and when $x=\mu$, the value of $z$ is zero.
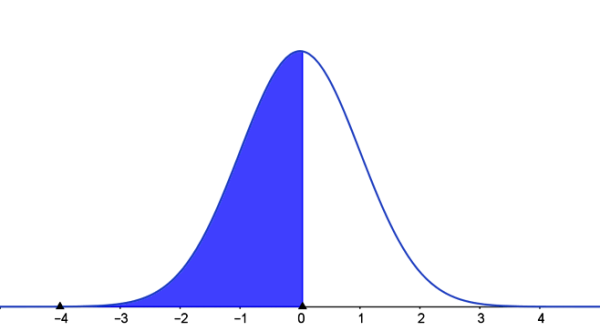
Since the total area under the curve is $1$, and the curve is symmetric with respect to the $y$-axis, the areas under the curve in the regions $x<0$ and $x>0$ are equal $0.5$, i.e
$P(Z<0)=P(Z>0)=0.5$.
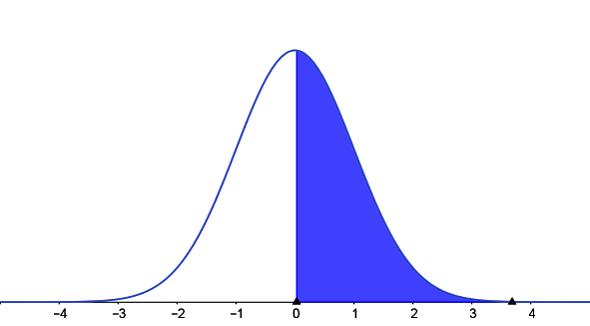
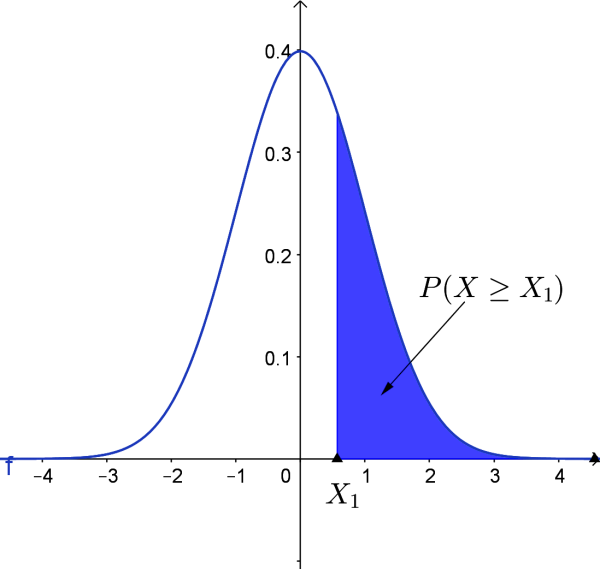
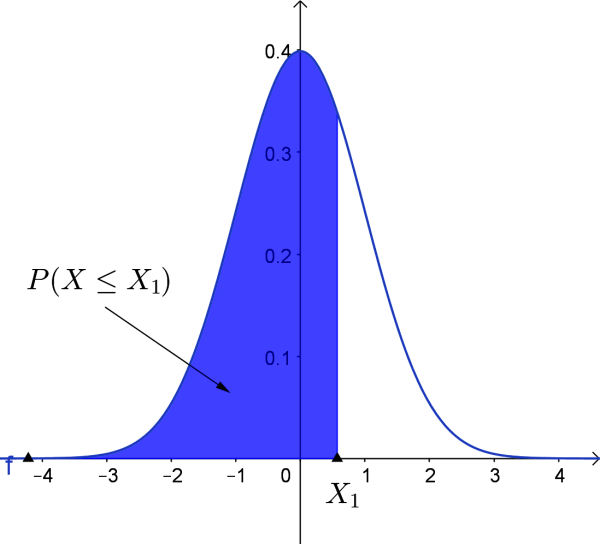
Let $A(X_1)$ be the area under the standard normal curve. So, $A(X_1)$ is the probability that the value of the random variable $X$ observed for an individual chosen at random from the population is less than or equal to $X_1$, i.e. $A(X_1) = P(X\leq X_1)$. To calculate probabilities, we should follow the next rules:
-
$ P(X\leq X_1)=\left\{ \begin{array}{ll} A(X_1), & X_1>0\\ 1-A(X_1), & X_1<0 \end{array} \right.$
-
$ P(X\geq X_1)=\left\{ \begin{array}{ll} 1-A(X_1), & X_1>0\\ A(X_1), & X_1<0 \end{array} \right.$
-
$ P( X_1\leq X\leq X_2)=A(X_2)-A(X_1)$
Applications or Use of Normal Distribution
The normal distribution is important in education because many variables are distributed normally or approximately normally. For example, reading, introversion, satisfaction, and memory are approximately normally distributed. It's widely applicable in statistics and probability. Some types of statistical tests are obtained for normal distributions. Moreover, these tests work well even if the distribution is approximately normally distributed.
Practice Problems for Normal Distribution
Practice Problem 1:
Find the probability that $X$ takes values between $1$ and $2$ with mean 0 and standard deviation 1.
Practice Problem 2:
Find the probability for $X>2$ with mean 0 and standard deviation 1.
Practice Problem 3:
In the ATP list the top $15\%$ of players received the invitation to participate in the prestigious tournament. If $ATP\sim N(100, 50^2)$, find how does the ATP score have to be to qualify for a tournament.
The normal distribution calculator, formula and practice problems would be very useful for grade school students of K-12 education primarily in statistical and probability problems.
Because many natural phenomena have approximately the normal distribution, some real life situations can be solved by using this concept.
