Poisson Distribution Calculator
Poisson Distribution - work with steps
Input Data :
λ (Average Rate of Success) = 2.5
X (Poisson Random Variable) = 8
Objective :
Find what is poisson distribution for given input data?
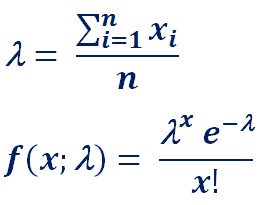
Formula :

Solution :
f(x, λ) = 2.58 x e-2.58!
= 1525.8789 x 0.08218 x 7 x 6 x 5 x 4 x 3 x 2 x 1
= 125.251840320
Poisson Distribution = 0.0031
Poisson distribution calculator calculates the probability of given number of events that occurred in a fixed interval of time with respect to the known average rate of events occurred. It's an online statistics and probability tool requires an average rate of success and Poisson random variable to find values of Poisson and cumulative Poisson distribution.
It is necessary to follow the next steps:
- Enter an average rate of success and Poisson random variable in the box. The value of average rate must be positive real number while the value of Poisson random variable must positive integers.
- Press the "GENERATE WORK" button to make the computation.
- Poisson distribution calculator will estimate the probability of a certain number of events happening in a given time.
Output: A real number in $[0,1]$.
Poisson Distribution Formula:
What is Poisson Distribution?
The Poisson distribution is a probability distribution. It represents the probability of some number of events occurring during some time period. The Poisson distribution can also be used for the number of events in other intervals such as distance, area or volume. If the number of trials becomes larger and larger as the probability of successes becomes smaller and smaller, then the binomial distribution becomes the Poisson distribution. There are some properties of the Poisson distribution:
- The experiment consists of events that will occur during the same time or in a specific distance, area, or volume;
- The probability that an event occurs in a given time, distance, area, or volume is the same;
- Events are independent;
How to Find Probability of Events in Poisson Distribution?
To calculate the Poisson distribution, we need to know the average number of events. This value is called the rate of success, and it is usually denoted by $\lambda$. The probability of a certain number of occurrences is derived by the following formula:
The previous equation can be reformulated if, instead of the average number of events, we use a time rate. So,
The Poisson distribution work with steps shows the complete step-by-step calculation for finding the probability of a certain number of occurrences $X=8$ if the average number of events is $\lambda=2.4$. For any other values of the average rate of success and Poisson random variable, just supply the appropriate numbers and click on the "GENERATE WORK" button. The grade school students may use this Poisson distribution to generate the work, verify the results derived by hand or do their homework problems efficiently.
Poisson Distribution Practice Problems
Poisson distribution is important in many fields, for example in biology, telecommunication, astronomy, engineering, financial sectors, radioactivity, sports, surveys, IT sectors, etc to find the number of events occurred in fixed time intervals. For instance, the Poisson distribution calculator can be applied in the following situations:
- to find the probability distribution the number of trains arriving at a station per hour;
- to find the probability distribution the number absent student during the school year;
- to find the probability distribution the number of visitors at football game per month.
Practice Problem 1 :
Shop sells sneakers at an average rate of 2 per day. Find the probability that the shop sells `15` sneakers in a week.
Practice Problem 2 :
The number of flats sold by an agency has a Poisson distribution, with a mean of `3` per week. Find the probability that in the next three-week agency sells 6 flats.
The Poisson distribution calculator, formula, work with steps, real world problems and practice problems would be very useful for grade school students (K-12 education) to learn what is Poisson distribution in statistics and probability, and how to find the corresponding probability. Many real-life situations can be expressed by the Poisson distribution, so it is important to understand this concept.
